FY2022 investor letter
Monday 22 August 2022
Investing insights
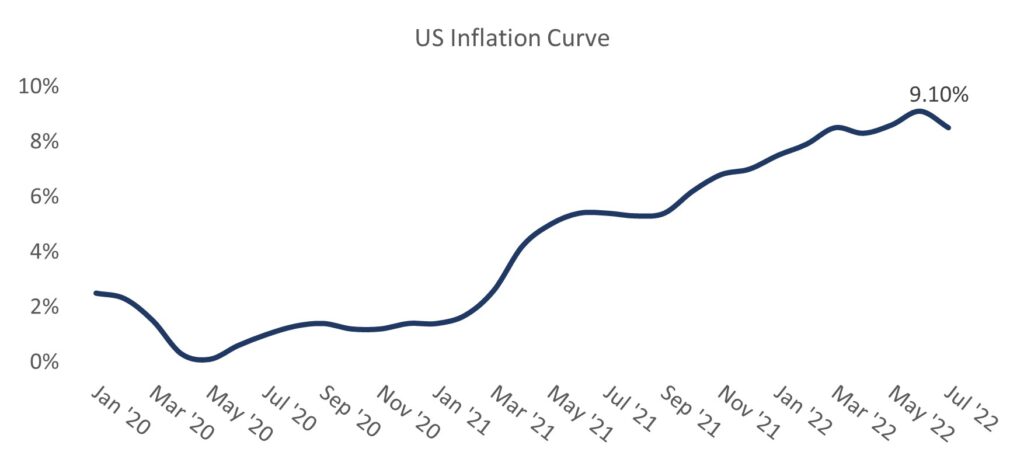
FY22 has been a challenging year for investors. As economies around the world reopened, strong consumer demand and tight supply led to surging inflation. The hope supply chains would resolve was dashed when Russia invaded Ukraine on 24 February this year driving inflation in oil and soft commodities. When China, the world’s second largest economy, went into lock down, an already tight supply chain worsened. This chart highlights the path of inflation over the course of the pandemic.
Central banks around the world responded to higher inflation by committing to raise interest rates to cool their economies. Unfortunately, central banks can only influence the demand side of the equation through higher interest rates and quantitative tightening. It is too early to determine the effectiveness of these policies, however we are seeing some key commodities like oil and copper roll over, pointing to lower inflation ahead.
USA
Despite strong household balance sheets and low unemployment, consumer sentiment continues to deteriorate. Households are becoming more cautious in their expenditure decisions as uncertainty about the economic outlook persists. As inflation rises, purchasing power falls, and this has been particularly evident in the price of essentials such as food, housing and transportation.
The market is pricing in another 75-basis point interest rate increase in September. Demand is beginning to cool, and the Federal Reserve noted in their July minutes that US real gross domestic product had declined over the first half of the calendar year. Treasury yields responded by grinding lower as market participants began to shift their concerns to the prospect of a recession.
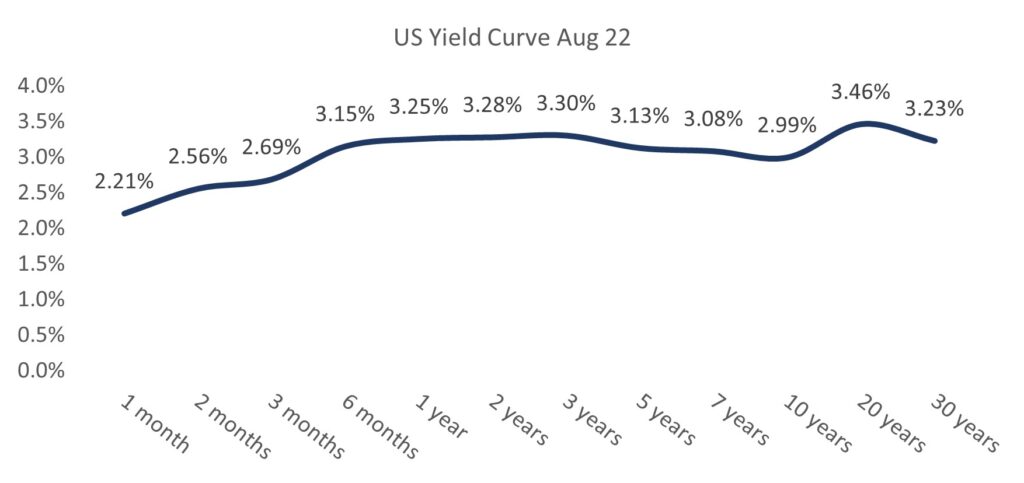
Despite the uncertain outlook for inflation in the short run, the yield curve indicates market participants are expecting inflation to moderate and economic growth to slow. The yield curve is currently inverted between the 2 year and 10 year, indicating a very strong chance of a recession in the coming year. However, long term expectations for inflation remain well anchored.
The forces that drove rates into negative yields for forty years prior to the pandemic remain ‘in play’ and it is hard to mount a solid case as to why we will not return to secular stagnation once the effects of the recent stimulus fade. Record levels of government debt, an aging population and innovation all point to inflation easing once supply chains return to normality.
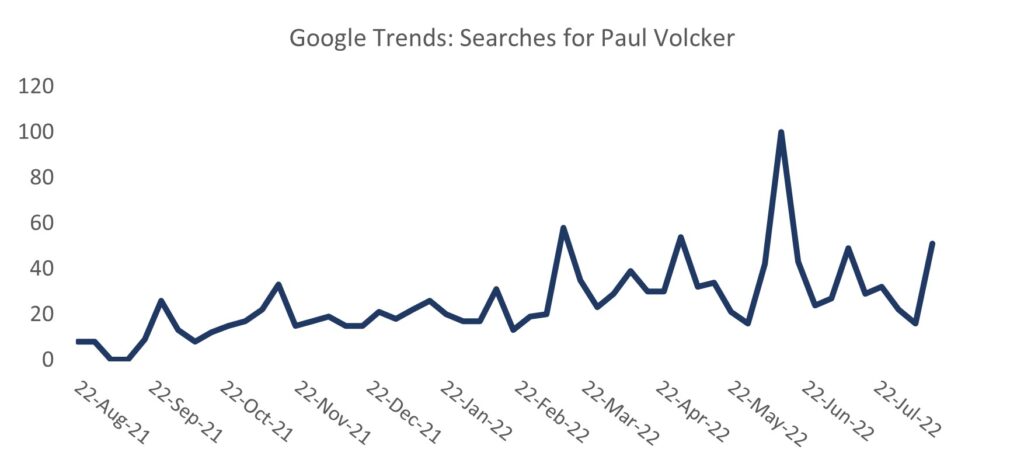
As a journalist recently commented, at least Google searches for Paul Volcker, the man who broke the back of inflation in the 1980s, have moderated since peaking in mid-June. Coupled with this, gold, a traditional inflation hedge, has also dropped.
China
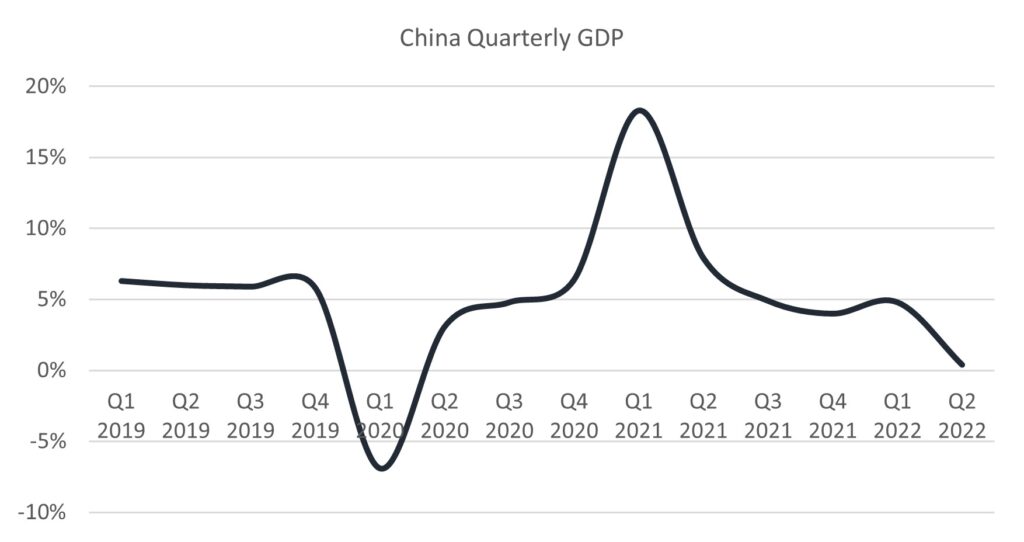
China, a powerful engine of global growth, is also spluttering. The MSCI China Index has fallen 50% from its February 2021 high and Chinese stocks are now trading on 10 times 2023 earnings – a valuation even the most bearish of commentators could not have envisioned 18 months ago. The continued slump in property prices, once a source of economic strength, is contributing to deteriorating household wealth and removing a key source of economic growth. China recently cut its benchmark lending rate and lowered the mortgage reference, as Beijing ramps efforts to revive an economy hobbled by a looming property crisis. The chart below shows the effects of the COVID lockdowns on the Chinese economy.
Europe
Europe generated 0.6% of real GDP growth in 1Q22, however excluding Ireland it was up only 0.3%.Households are feeling the pinch from rising energy and food prices. A recent consumer survey found European households do not expect to maintain consumption in real terms. Nevertheless, the labour market recovery is aiding GDP growth and survey data continues to point to favourable labour market developments. Wage inflation continues to be largely contained.
While it is important to understand the global macro-outlook, it does not influence our investment decisions. We prefer to focus on more tangible factors like a company’s competitive position and its long-term growth prospects. We used the most recent decline in equity prices to increase the Portfolio’s weighting to companies with the strongest competitive advantage and ability to grow their free cash flow over the next five years.
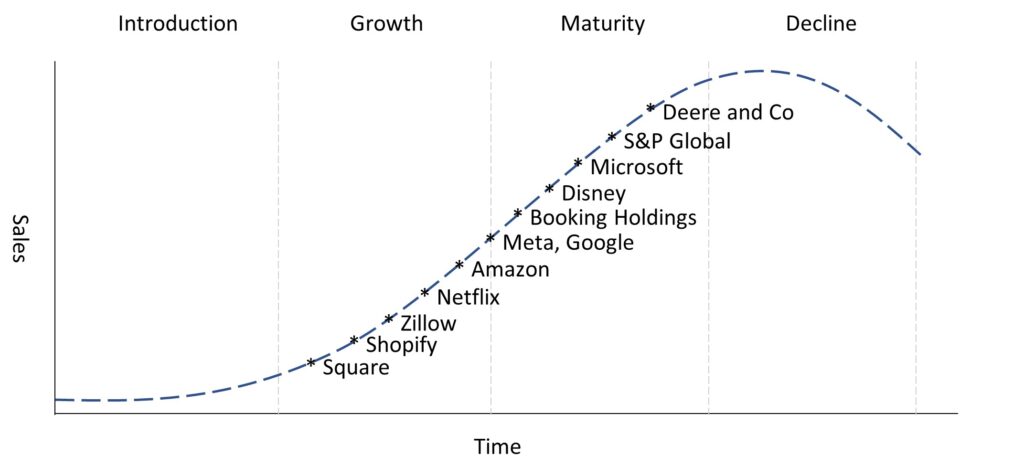
The chart below highlights each of our portfolio companies and their position relative to their stage of lifecycle.
The companies with the greatest long-term potential are those which have experienced the most selling pressure. As investors’ fears rose, they responded by selling long duration assets. This does not make sense to us, and we responded by increasing our exposure to these companies. We are confident our portfolio companies can weather any storm due to their robust business models, strong balance sheet and structural growth.
Four key secular trends
It is important to recognise the difference between cyclical and structural growth. Our portfolio companies are exposed to several long term structural trends:
- Cloud
- Ecommerce
- Software enabled payments; and
- Digital advertising
Today, these trends are being discounted by the market as investors focus on the near term impact of a slowdown in consumer spending. Despite this short term headwind, each of the trends increase their share of the total market and will do so over the long term. We discuss each of these opportunities below.
Cloud
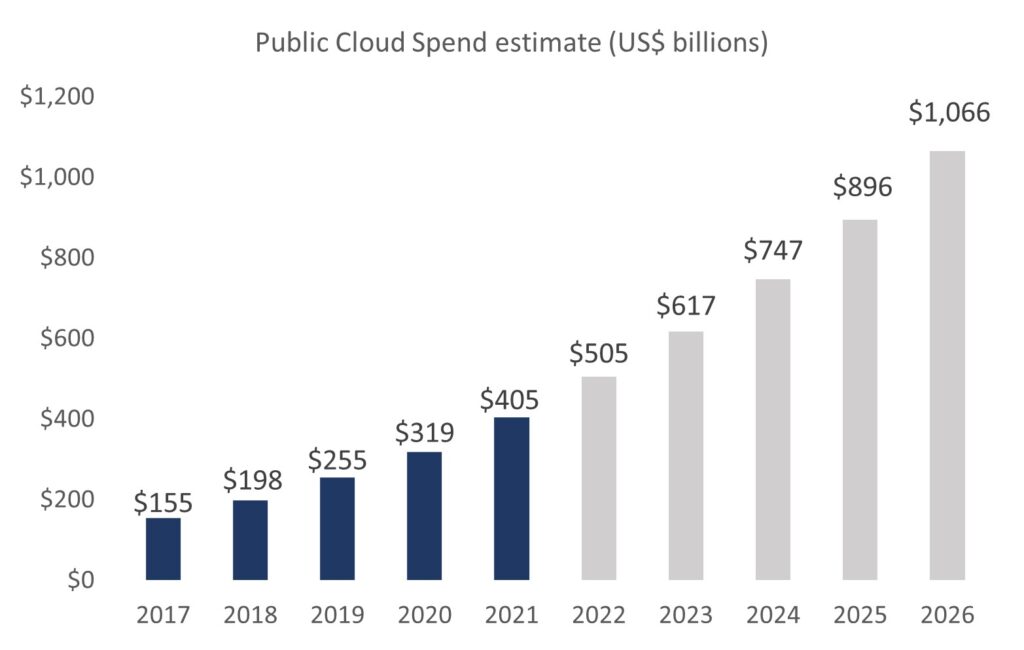
Public cloud spending is expected to increase from US$400 billion in 2021 to over US$1 trillion by 2026, growing at a compound annual growth rate of more than 21%. This is being driven by business digitisation, a trend we have been following for many years but which accelerated when the pandemic uncovered the cost of not being in the cloud. Three public cloud companies are at the core of this trend: Amazon (AWS), Microsoft (Azure) and Google (GCP).
We estimate in the last 12 months these companies spent a combined US$60 billion building out their cloud infrastructure, but we estimate they have spent between $100 and $200 billion in total capital investment for their cloud businesses, an investment that provides them with an almost impenetrable moat.
Source: IDC, Bloomberg
Ecommerce
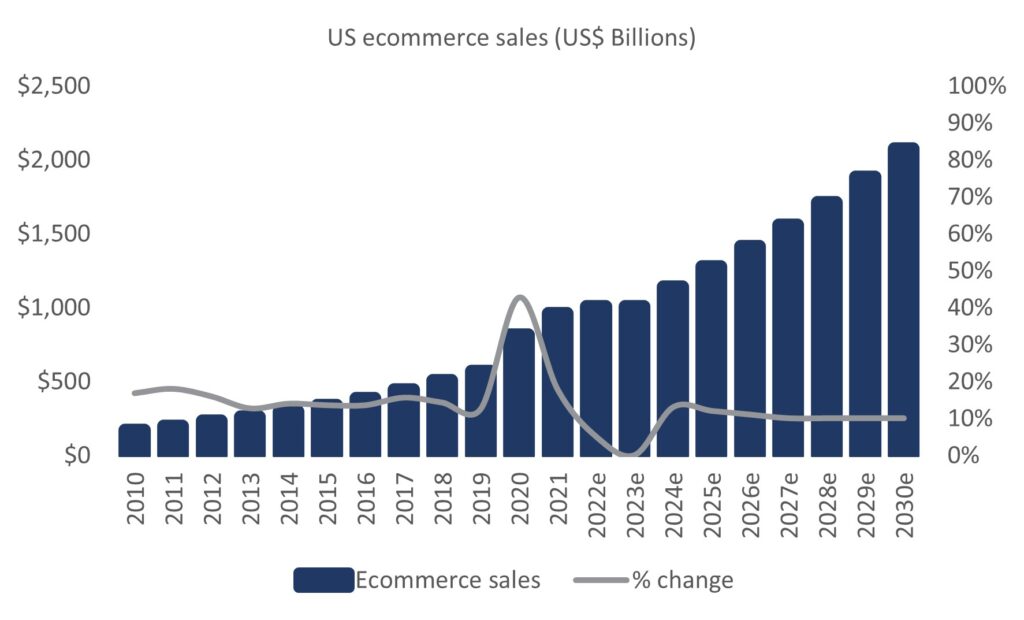
The ecommerce market enjoyed a pandemic fuelled surge in 2020 – 2021 as businesses and consumers were forced to stay home amid worldwide lockdowns. While we expect growth to normalise in 2022 from these unusual levels, the market’s focus on short-term growth rates hides what we believe is a significant long term structural growth trend. There are 3 things driving this trend:
- Low ecommerce penetration rate
- Relative convenience of ecommerce
- Demographic tailwinds
In the US ecommerce penetration of total retail is currently around 15%. In more advanced markets it’s close to 50%. We believe shopping online is fundamentally more convenient than in-person and as millennials and Gen Zers increase their spending power, their natural propensity to shop online will drive penetration towards 30% by 2030. As a result, we expect ecommerce sales to more than double over the next eight years.
Source: US Census Bureau, Swell estimates
Software enabled payments
As payments developed, banks and their partners were the only choice for merchants wishing to accept inperson payments by debit or credit card. The technology was restricted to large merchants, as the payments were required to be underwritten by a bank or bank acquirer. Today, fintech companies have emerged to provide these services to merchants of all sizes, and they are taking meaningful share from banks. In the last three years alone, software enabled payments have grown from 8% of the total market to 15%1 , nearly doubling their share of transactions.
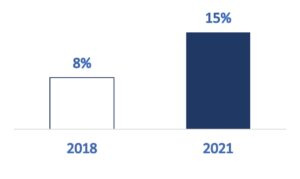 1 Source: Block 2022 Investor Day. Data represents share of software-enabled merchant acquirer payment card processing volumes within the top 50 domestic merchant acquirers based on the Strawchecker Group’s Directory of US Merchant Acquirers eReport, released 2022. Software enabled payments determined based on Block’s assumptions.
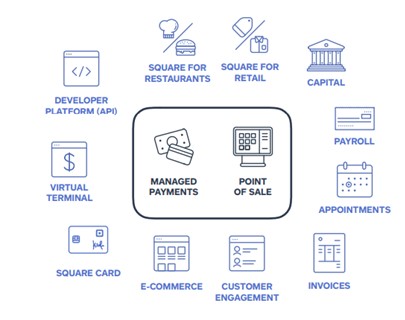
Merchants see value in the expanding suite of cloud based software tools that help them seamlessly run their business. These software tools have multiplied from traditional payments to include invoicing, scheduling, marketing, loyalty programs and employee management. With more than 3 million merchants using its software, Block is well positioned to increase its average revenue per merchant into the future.
Digital advertising
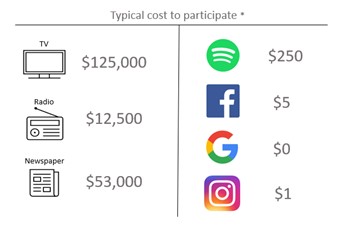
The shift from traditional advertising (TV, print and radio), to digital advertising is a long term, secular trend. A major challenge for advertisers with traditional media has been the difficulty in measuring its effectiveness. It is also very expensive as the following image highlights, and therefore only available to companies with large advertising budgets.
* TV: based on average national broadcast costs for a 30 second commercial in the US of $104,000 and production costs between $2,000 and $50,000. Radio: based on estimates for a typical 13 week cost proposal. Newspaper: based on the average of the estimated full page ad costs for 11 regional newspapers in the US. Sources Fit Small Business, Statista, AdAge. Snapchat, Facebook and Instagram minimum spend limits are on a per day basis. Spotify’s minimum has no time requirement.
Digital advertising does not have the same limitation, as each format provides feedback and therefore the ability to calculate a return on investment. The cost is also a point of difference, with digital campaigns meaningfully cheaper than traditional campaigns. We believe these benefits will unlock future growth for small business, and therefore drive the democratisation of advertising.
This means small businesses are now able to reach their audience in a measurable way. Once only the domain of large brands, SMEs can now target niche segments, for example, Facebook boasts over 200 million small businesses on the platform, with around 10 million of those, or 5%, advertising. This represents a large opportunity to increase digital advertising spend into the future.
As consumers spend more time online, and as digital ad formats develop, we see significant growth in digital advertising into the future.
Special mentions
Given the significant share price volatility in Block, Shopify and Zillow; we would like to provide some context around their performance and also the opportunity we see for them over the long term.
Block (previously Square)
Square helps sellers more easily run and grow their business with its integrated ecosystem of commerce solutions, business software and banking services. Cash App is focused on redefining consumers’ relationship with money by making it more relatable, instantly available, and universally accessible.
We believe Block is uniquely positioned to materially increase its revenue and earnings over the next 5 years solidifying its position as a global leader in software enabled payments. There is a secular shift toward software enabled payments, away from legacy technology supplied by traditional banks and Block is strategically positioned to drive this secular shift with its leading technology and two sided network.
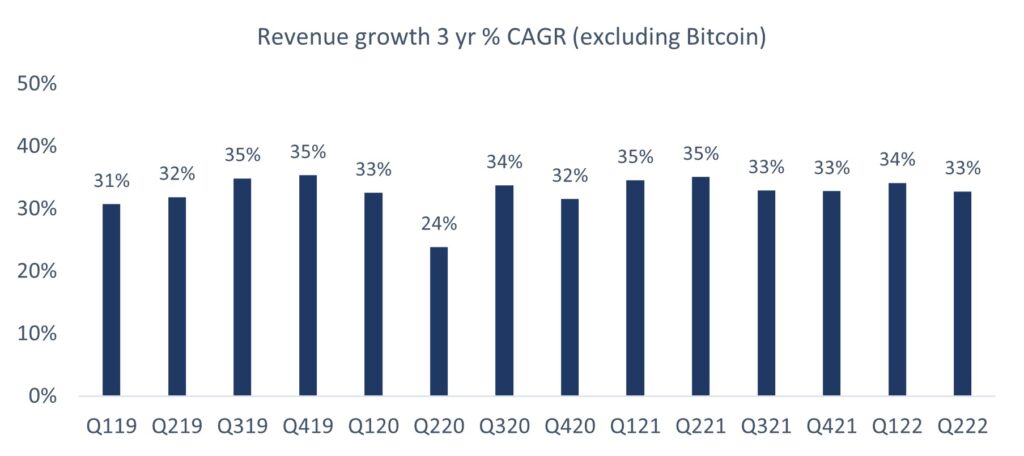
Despite acceleration through the COVID pandemic, Block continues to compound its growth. If we look at the three-year compound annual growth in revenue for Q219 to Q222, Block increased revenue by 33% per annum from $1.005 billion to $2.354 billion. This demonstrates the strength of its business model and smooths out the impact from the pandemic. Block’s business includes its Cash App ecosystem of 47 million monthly active users (consumers) and its Square software enabled payments platform for business which processed $48.3 billion of payments in Q222.
Shopify
Shopify helps people achieve independence, making it easier to start, run, and grow a business by reducing the barriers to business ownership to make commerce better for everyone.
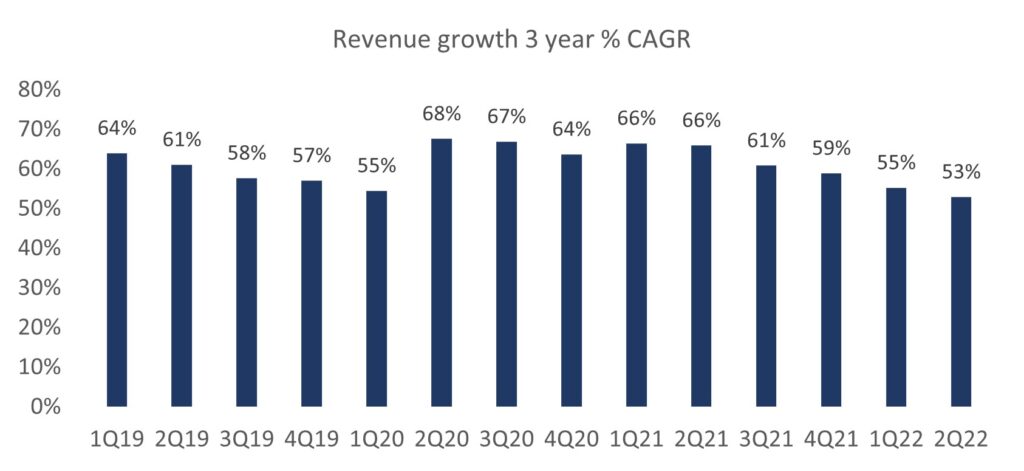
Shopify increased revenue by 16% in Q222, a significant deceleration from the pandemic fuelled growth it experienced in 2021. However, if we adjust for the pandemic and review the growth rate on the same quarter in 2019, revenue increased by 53% on a 3 year compound annual growth rate. In absolute terms, Shopify’s revenue increased from $362 million to $1.3 billion.
Shopify’s cloud software provides retail merchants with online and offline commerce solutions and is a market leader in product innovation. As sales channels fragment, Shopify’s software provides a unified view across all – online and offline, marketplaces and social media.
Zillow
Zillow has a simple mission, to give people the power to unlock life’s next chapter.
Today, millions of people in the US start their search for a home on Zillow. It connects buyers and renters with agents and homeowners empowering them with knowledge to make the process of transacting more seamless and convenient. With 234 million monthly unique users and 2.9 billion visits per quarter, it maintains an enviable position which is deeply under monetised.
Following the exit of the iBuying business – Zillow Offers, it recently announced a multi-year partnership with category leader, Opendoor Technologies. The partnership will allow home sellers on the Zillow platform to seamlessly request an Opendoor offer to sell their home. Opendoor recently announced 2Q22 results delivering revenue of $4.2 billion +254%, with 10,482 homes sold in the quarter. The partnership enables Zillow to generate upside from the growth in iBuying while maintaining the benefits of their capital light business model.
We expect FY22 and FY23 to be challenging for Zillow as macro conditions and rising interest rates depress housing affordability. But tough times don’t last forever and Zillow is uniquely positioned with $2.1 billion in cash and cash equivalents allowing it to invest through the cycle.
We are very excited by our portfolio companies and believe the tough macro backdrop will allow our companies to prosper as they continue investing through the cycle. Thank you for your continued support. We look forward to updating you on your investments again soon.
Lachlan and the team
August 2022
This document has been prepared and approved by Swell Asset Management Pty Limited (ABN 16 168 141 204) Corporate Authorised Representative (CAR No. 465285) of Hughes Funds Management Pty Limited (ABN 42 167 950 236) (AFSL No. 460572). The information in this document is of a general nature only, is not personal investment advice and has been prepared without taking into account your investment objectives, financial situation or particular financial or taxation needs. Investors should read and consider the investment in full and seek advice from a financial adviser or other professional adviser before deciding to invest.
The information in this document is general information only. To the extent certain statements in this document may constitute forward–looking statements or statements about future matters, the information reflects Swell Asset Management’s intent, belief or expectations at the date of this document. This document is not a prospectus, product disclosure statement, disclosure document or other offer document under Australian law or under any other law and does not purport to be complete nor does it contain all of the information which would be required in such a document prepared in accordance with the requirements of the Corporations Act 2001 (Cwlth). This document is not, and does not constitute, financial product advice, an offer to issue or sell or the solicitation, invitation or recommendation to purchase any securities and neither this document nor anything contained within it will form the basis of any offer, contract or commitment.


